


New figures show a big increase in people divorcing after 20 years or more of marriage. But it’s not as big as some would have you believe.
New figures from the Australian Institute of Family Studies have shown a big increase in people divorcing after 20 years or more of marriage. However, it’s not exactly as big as some media outlets would lead you to believe as most publications got the numbers wrong.
‘Rate of divorce after 20 years of marriage doubles‘, according to one story. And ‘Parents wait until children go, then do the same thing‘ from another.
The headline statistic is that people are waiting longer to divorce. This is based on an analysis of the proportion of marriages lasting 20 years or over before ending in divorce. A media release from the AIFS put this figure at 13% in 1990 and 28% in 2011, which many people erroneously reported.
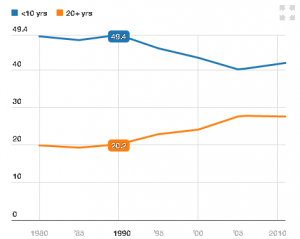
However, the actual report shows 20.2% in 1990 to 27.6% in 2011. The same figure for ‘final separation’ is 13% to 18.3%. They’ve mixed up the separation and divorce numbers. There’s actually a much more mild 7.4% increase between 1990 and 2011. So we are seeing an increase in the duration of marriages that end in divorce, just not quite as much as all that.
Proportion of marriages that lasted less than 10 years and greater than 20
So, what are the other trends coming out of this new report?
You’re more likely to get divorced when you’re younger.
And of younger people who are married, women are more likely to experience divorce than men. In fact the rates of divorce are higher for women than men up until the 40-44 age bracket, where men then have higher rates up to 65 and over, likely due to an overall tendency for men in marriages to be older, and women younger. The AIFS report also suggests older men have a higher tendency to remarry than older women.
Age-specific divorce per 1000 people, married men and women, 2011
Divorce is down, and has been for a while.
From 2007-2011 the rate per 1000 people has stayed around 2.2 and 2.3. This is down from 2.9 in 1996, and very far down from the biggest peak of 4.9 in 1976 after the Family Law Act 1975 came into effect.
The age that people get divorced has increased dramatically.
The median age of divorce for men is at the highest its been since 1970, with 44.5 in 2011. Women are similarly high at 41.7. This is up from a historical low of 35 and 33 for men and women respectively in 1980.
Divorce and marriage rate – number per 1000 people
Divorces that involve children are decreasing too, which the AIFS suggests means people actually are staying together for the sake of the kids. This fits with the increase in the proportion of longer marriages ending in divorce we saw above.
The report also highlights the relative instability of people who are unmarried, but living together, versus married couples. Citing numbers from the Growing Up In Australia report – for infants who were living with married parents in 2004, 12% were with only one parent by 2010. The same figure for unmarried couples cohabiting is 27%, suggesting unmarried couples are more than twice as likely to break up.